OverView
이번시간에는 ELK 스택에서 데이터 수집을 담당하는 Logstash에 대해서 간단하게 알아보도록 하겠다. 이 글은 전적으로 https://www.elastic.co/guide/en/logstash/7.10/getting-started-with-logstash.html를 참고했다.
Logstash란?
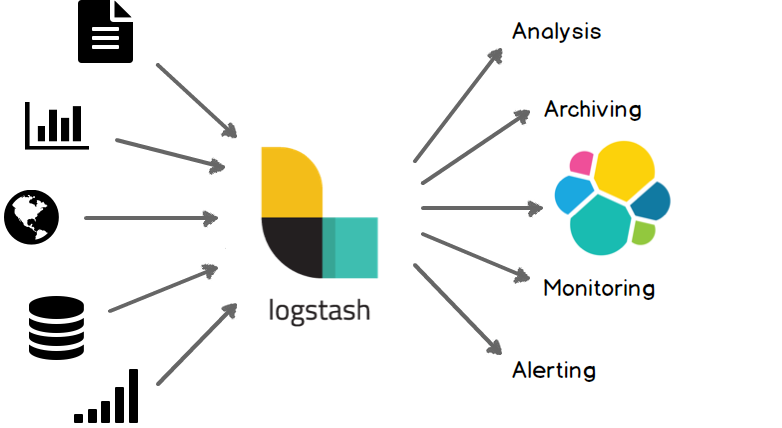
Logstash는 실시간 파이프라이닝 기능이 있는 오픈소스 데이터 수집 엔진이다. Logstash는 서로 다른 소스의 데이터를 동적으로 통합하고 데이터를 원하는 대상으로 필터링 할 수 있다.
출처 https://www.elastic.co/guide/en/logstash/7.10/introduction.html#_the_web
Logstash를 활용해서 Apache와 같은 WebServer의 AccessLog, MySQL의 Slow Query Log 또는 Stream 형태의 무한한 데이터와 IoT 데이터 까지 다양한 형태로 input 데이터를 받아서 Elasticsearch 에게 전달하거나 또는 MongoDB와 같은 NoSQL에 데이터를 적재할 수 있다.
Logstash 설치하기
Logstash는 jdk를 필수로하는데 다음 버전중 한개만 있으면 된다.
- Java 8
- Java 11
- Java 14
기본적으로 Logstash는 JAVA_HOME 에 설정된 Java 버전을 사용하고 JAVA_HOME이 설정되지 않았다면 설정해야 한다.
Logstash는 다음 세가지 방법으로 설치할 수 있다.
Binary 다운로드
Package 설치 (apt 기반)
wget -qO - https://artifacts.elastic.co/GPG-KEY-elasticsearch | sudo apt-key add -

echo "deb https://artifacts.elastic.co/packages/7.x/apt stable main" | sudo tee -a /etc/apt/sources.list.d/elastic-7.x.list

sudo apt-get update && sudo apt-get install logstash
Docker 컨테이너
docker pull docker.elastic.co/logstash/logstash:7.10.2
Logstash 사용하기
Logstash는 기본적으로 두 개의 필수 요소인 input과 output을 가지고 선택적으로 filter라는 옵션을 가질 수 있다. 다음 명령어를 통해서 간단하게 테스트해보자. input과 output을 테스트해보자.
{logstash-home}/bin/logstash -e 'input { stdin { } } output { stdout {} }'
{logstash-home}을 tar 파일 등으로 다운받았으면 압축을 푼 폴더 하위에서 /bin 디렉토리를 찾으면 되고 만약 package 기반으로 설치했다면 /usr/share/logstash 하위에서 찾을 수 있다. 더욱더 자세한 내용은 https://www.elastic.co/guide/en/logstash/7.10/dir-layout.html에서 찾을 수 있다.
기본적으로 별도의 .conf 파일을 사용해서 구성파일을 만들고 사용하지만 -e 옵션을 활용해서 직접 구성 파일을 지정할 수 있다. 위 명령어를 사용해서 Logstash가 완전히 실행되었다면 std 입력을 통해 파이프라이닝 되는것을 확인할 수 있다.
The stdin plugin is now waiting for input:
[INFO ] 2021-01-25 05:13:22.778 [Agent thread] agent - Pipelines running {:count=>1, :running_pipelines=>[:main], :non_running_pipelines=>[]}
[INFO ] 2021-01-25 05:13:23.069 [Api Webserver] agent - Successfully started Logstash API endpoint {:port=>9600}
hello logstash
{
          "host" => "instance-1",
       "message" => "hello logstash",
    "@timestamp" => 2021-01-25T06:46:13.109Z,
      "@version" => "1"
}
Logstash + Filebeat로 Apache Log 파이프라이닝 구성하기
일반적으로 로그 모니터링 시스템을 구성할때는 ELK + Xbeat를 사용한다. 여기에서는 파일 수집기인 Filebeat를 사용한다.
Filebeat는 경량 오픈소스 파일 수집기이고 주로 로그파일을 가져와서 Logstash에게 공급하는 역할을 한다. 예를들어 WAS가 이중화되어 있을 경우 각각의 서버에 Logstash를 구성하지 않고 경량의 Filebeat를 각각 구성한 뒤에 Logstash로 전달하는 구성을 많이 선호한다. 간단하게 다음 샘플 데이터를 활용해서 Apache Log 파이프라이닝을 구성해보도록 하자
Apache 설치 & 실행하기
아파치를 설치 & 실행하고
sudo apt install apache2

systemctl start apache2
잘 올라왔는지 테스트해보자
curl localhost


<html>
	...
          <p>
                Please use the <tt>ubuntu-bug</tt> tool to report bugs in the
                Apache2 package with Ubuntu. However, check <a
                href="https://bugs.launchpad.net/ubuntu/+source/apache2"
                rel="nofollow">existing bug reports</a> before reporting a new bug.
          </p>
          <p>
                Please report bugs specific to modules (such as PHP and others)
                to respective packages, not to the web server itself.
          </p>
    ...
</html>
Filebeat 설치하기 (ubuntu)
curl -L -O https://artifacts.elastic.co/downloads/beats/filebeat/filebeat-7.10.2-amd64.deb
sudo dpkg -i filebeat-7.10.2-amd64.deb
https://www.elastic.co/guide/en/beats/filebeat/current/filebeat-installation-configuration.html에서 더 다양한 os 옵션을 찾을 수 있다.
Filebeat 설정하기
Filebeat이 설치되었다면 /etc/filebeat/filebeat.yml 파일을 다음과 같이 수정한다.
filebeat.inputs:
- type: log
  paths:
    - /var/log/apache2/access.log
output.logstash:
  hosts: ["localhost:5044"]
paths옵션은 반드시 절대경로여야 한다.
Logstash 설정하기
.conf 파일들을 모아놓는 /etc/logstash/conf.d/ 디렉토리에서 apache-log.conf 파일을 다음과 같이 생성한다.
input {
    beats {
        port => "5044"
    }
}
filter {
    grok {
        match => { "message" => "%{COMBINEDAPACHELOG}"}
    }
}
output {
    stdout { codec => rubydebug }
}
input과 output 외에 filter도 설정해놨는데 grok이라는 별도의 필터 플러그인을 사용했다. grok 필터 플러그인을 사용하면 구조화되지 않은 로그 데이터를 구조화되고 쿼리 가능한 것으로 구문 분석 할 수 있다. grok에 대한 자세한 정보는 https://www.elastic.co/guide/en/logstash/current/plugins-filters-grok.html 에서 찾아볼 수 있다.
grok 플러그인의 %{COMBINEDAPACHELOG}의 variable 표는 다음과 같다.
| Information | Field Name |
|---|---|
| IP Address | clientip |
| User ID | ident |
| User Authentication | auth |
| timestamp | timestamp |
| HTTP Verb | verb |
| Request body | request |
| HTTP Version | httpversion |
| HTTP Status Code | response |
| Bytes served | bytes |
| Referrer URL | referrer |
| User agent | agent |
- 추가적으로 grok debugger를 활용해서 디버깅할 수 있고 https://www.elastic.co/guide/en/kibana/7.10/xpack-grokdebugger.html 그냥 바로 사용할 수 있는 https://grokdebug.herokuapp.com/란 사이트도 있으니 참고하면 될 듯 하다.
- https://github.com/logstash-plugins/logstash-patterns-core/blob/master/patterns/httpd 여기에서 grok 필터 이외에 다양한 필터를 확인할 수 있다.
테스트해보기
먼저 Logstash를 다음 명령어로 실행시킨다.
/usr/share/logstash/bin/logstash -f /etc/logstash/conf.d/apache-log.conf --config.reload.automatic
--config.reload.automatic옵션은 config 파일이 변경되어도 자동으로 reload 되게 하는 옵션
Logstash가 문제없이 잘 동작한다면 Filebeat를 다음 명령어로 실행시킨다.
/usr/share/filebeat/bin/filebeat -e -c /etc/filebeat/filebeat.yml -d "publish"
이후에 curl localhost로 access log를 쌓으면 Filebeat가 동작할때마다 누적된 로그들이 Logstash로 이동하는 것을 확인할 수 있다.

마무리
아직 Elasticsearch와 Logstash를 연결하지는 않았지만 기본적인 파이프라인을 구성하는 방법과 간략한 프로세스는 이해할 수 있었다. 다음시간에는 Elasticsearch와 Logstash를 연결해서 ELK 스택을 구축해보자.
포스팅은 여기까지 하겠습니다. 퍼가실때는 출처를 반드시 남겨주세요!
References